Turnout in Cheltenham's Most Deprived Wards Was 20 Points Lower Than in Its Least Deprived
How turnout at Cheltenham's 2024 and 2026 borough elections compares across the town's 20 wards, ranked by the government's 2025 deprivation figures.
- RSS Feed subscribe via our feed/rss →
By Mat Benfield · Published 2026-10-27
Turnout at Cheltenham's May 2026 borough election averaged 32% in its four most deprived wards and 52% in its four least deprived.
Source: Cheltenham Borough Council election results and MHCLG English Indices of Deprivation 2025.
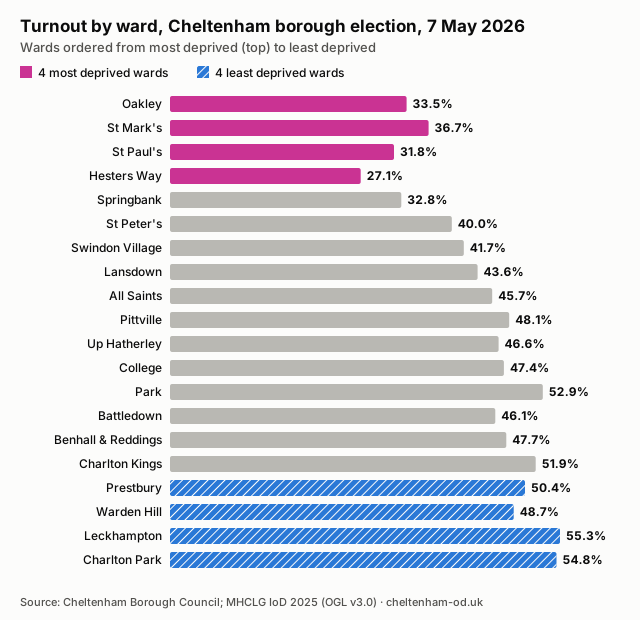
Cheltenham Open Data compared turnout in each of Cheltenham’s 20 wards with the government’s deprivation figures. Overall turnout in May 2026 was 44.0%. Hesters Way had the lowest, at 27.1%. Leckhampton had the highest, at 55.3%, more than twice as high. Results and turnout for every ward are on the Cheltenham wards page.
Key Figures
- 32%: average turnout in the four most deprived wards: Oakley, St Mark’s, St Paul’s and Hesters Way.
- 52%: average turnout in the four least deprived wards: Prestbury, Warden Hill, Leckhampton and Charlton Park.
- 27.1% in Hesters Way, the lowest of any ward.
- 55.3% in Leckhampton, the highest.
- 24% against 45%: the same comparison at the 2024 all-out election, when overall turnout was 35.1%.
The Same Pattern Every Time
Ranking the 20 wards by deprivation predicts turnout closely. The five wards with the lowest turnout in 2026 were the five most deprived. The six wards with the highest turnout were all among the eight least deprived.
The gap held in both of the last two borough elections. Turnout rose everywhere in 2026, by between five and 12 percentage points a ward, but the most deprived wards started lower and stayed lower. When the council was elected in full in 2024, fewer than one in five registered voters in Hesters Way cast a ballot.
Notes to Editors
- Method: Wards are ranked by their average Index of Multiple Deprivation 2025 score, calculated from the neighbourhoods in each ward. Group averages are simple averages of ward turnouts. Turnout is ballots cast as a share of the registered electorate, as published by the council.
- Sources: Cheltenham Borough Council election results, and the Ministry of Housing, Communities and Local Government English Indices of Deprivation 2025.
- Caveats: In 2026 one seat was contested in each ward, while all 40 seats were contested in 2024. Turnout depends on many things besides deprivation, including the age of residents, how many people have recently moved, students, and how close the contest was. These figures show a pattern across wards, not why any individual votes or not.
- Data and updates: The wards page updates after each borough election. For questions or interviews, use the contact page.
Data from Cheltenham Borough Council and the English Indices of Deprivation 2025, published under the Open Government Licence v3.0. Last updated 2026-09-21.
Cite This
Please credit Cheltenham Open Data and link to this page. Suggested citation:
Cheltenham Open Data (2026). Turnout in Cheltenham's Most Deprived Wards Was 20 Points Lower Than in Its Least Deprived. Published 2026-10-27. https://cheltenham-od.uk/news/cheltenham-turnout-deprivation. Data: Cheltenham Borough Council election results and MHCLG English Indices of Deprivation 2025, published under the Open Government Licence v3.0.To embed the chart on your own site, copy this code:
<a href="https://cheltenham-od.uk/news/cheltenham-turnout-deprivation"><img src="https://cheltenham-od.uk/assets/findings/cheltenham-turnout-deprivation.svg" alt="Bar chart of turnout in each Cheltenham ward at the 7 May 2026 borough election, ordered from most to least deprived. Turnout rises from 27% in Hesters Way and 32% in St Paul's to 55% in Leckhampton and Charlton Park." width="640"></a>The chart and data are free to reuse with credit. The underlying data is published under the Open Government Licence v3.0.
Spotted an error? Tell us and we will correct it, with a note on this page saying what changed and when.
FAQs
What Was the Turnout at the 2026 Cheltenham Borough Election?
- 44.0% across the borough, up from 35.1% at the 2024 election.
Which Cheltenham Ward Has the Lowest Turnout?
- Hesters Way, at 27.1% in 2026 and 19.4% in 2024.
Which Cheltenham Ward Has the Highest Turnout?
- Leckhampton, at 55.3% in 2026 and 50.4% in 2024.
Can I Use This Chart?
- Yes. Credit Cheltenham Open Data and link to this page. The embed code and a CSV of the figures are in the Cite This section above.