At Least 4,500 Privately Rented Homes in Cheltenham Fall Short of the 2030 Energy Standard
How energy efficient Cheltenham's privately rented homes are, ward by ward, ahead of the October 2030 deadline for rented homes to reach EPC band C.
- RSS Feed subscribe via our feed/rss →
By Mat Benfield · Published 2026-10-15
At least 4,571 of Cheltenham's privately rented homes are rated below EPC C, the standard they must meet by October 2030, but nine in ten could reach it with the improvements on their own certificates.
Source: Energy Performance of Buildings Register, Ministry of Housing, Communities and Local Government.
Cheltenham Open Data analysed the latest Energy Performance Certificate for every home in Cheltenham that has one. Of the 8,746 whose certificate records them as privately rented, 4,571 (52.3%) are rated D, E, F or G. From 1 October 2030, privately rented homes in England and Wales will need to reach the equivalent of band C. Our home energy ratings page maps every ward and neighbourhood.
Key Figures
- 4,571 privately rented homes are rated below C: 3,452 at D, 1,037 at E and 82 at F or G.
- 4,170 of them (91.2%) could reach C or better with the improvements recommended on their own certificates.
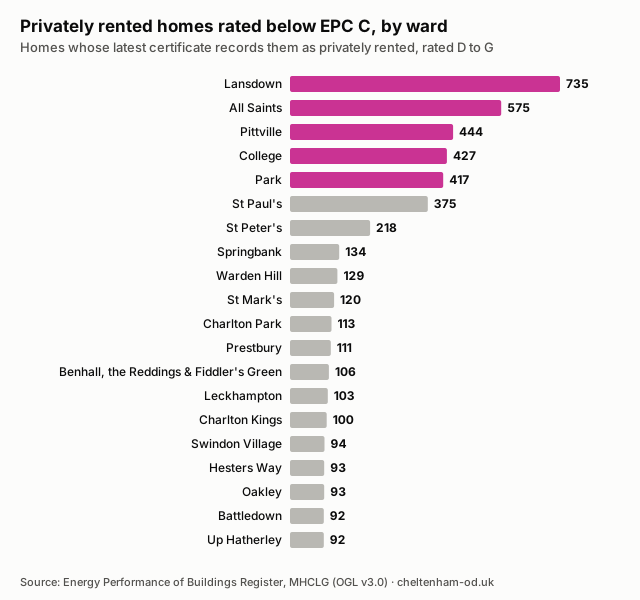
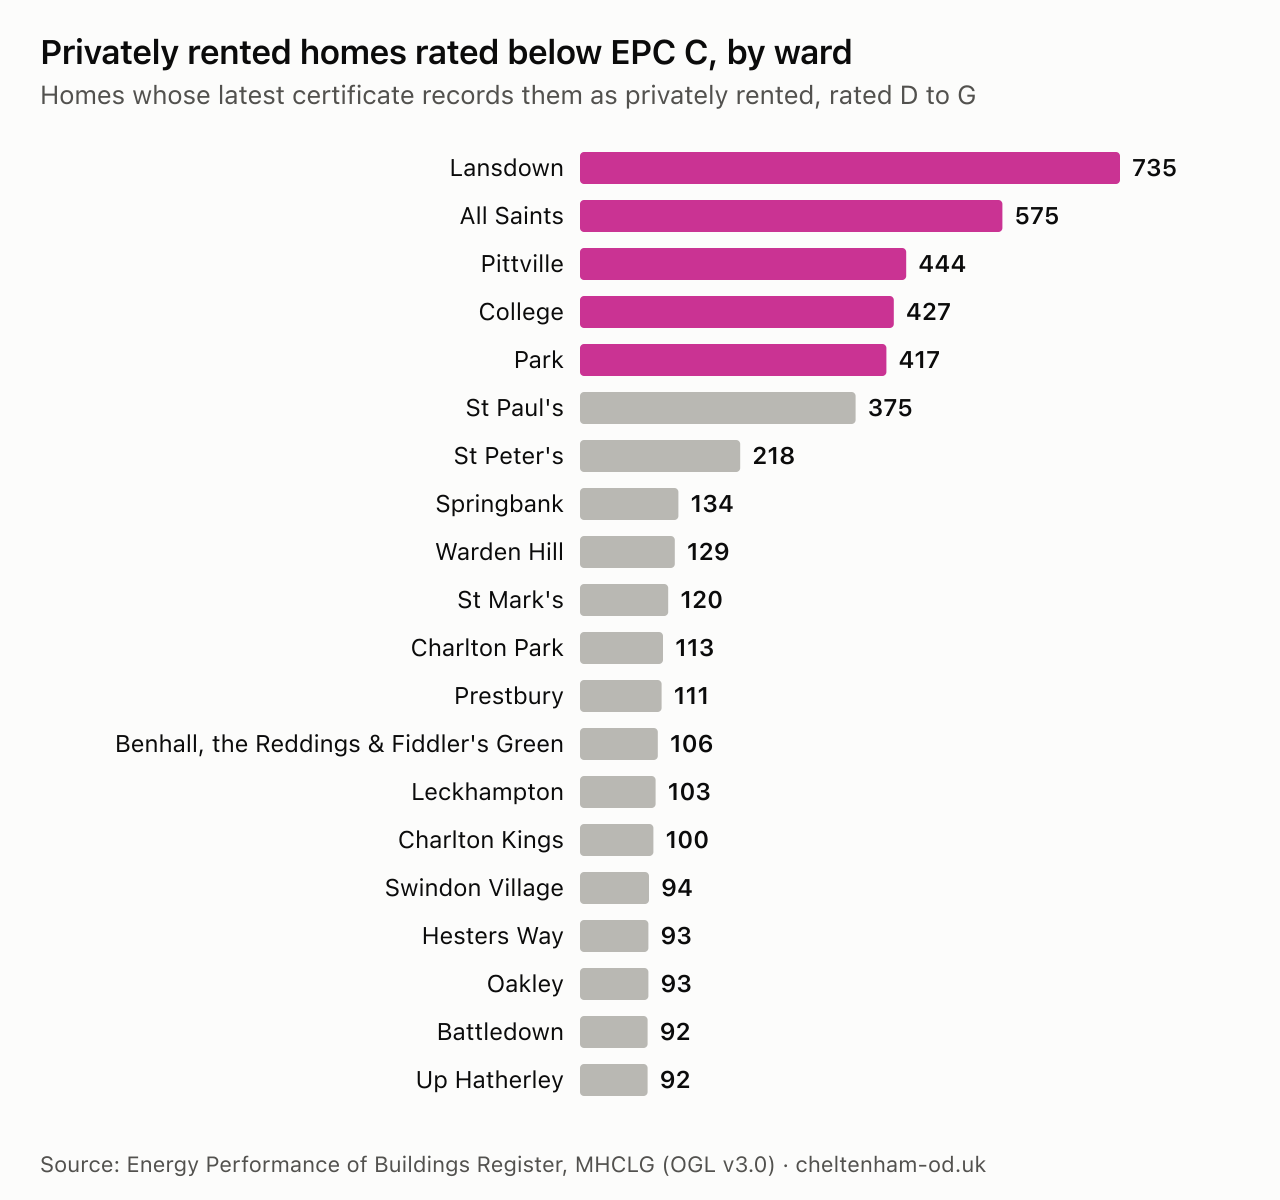
- 2,598 (57%) are in five central wards: Lansdown, All Saints, Pittville, College and Park.
- 47.7% of privately rented homes are rated C or better, against 40.9% of owner-occupied homes.
- 8,746 homes are recorded as privately rented, against 12,378 privately rented households in the 2021 Census, so the true numbers are higher.
Where the Homes Are
The homes below C are concentrated in the centre of town. Lansdown has the most, 735, followed by All Saints with 575, Pittville with 444, College with 427 and Park with 417. In each of these wards, between 57% and 64% of the privately rented homes on the register are below C.
Elsewhere the numbers are much smaller. Outside the centre, only St Paul’s (375) and St Peter’s (218) have more than 150, and most wards have between 90 and 135.
Better Than Owner-Occupied Homes
Privately rented homes are not the least efficient in Cheltenham. 47.7% are rated C or better, against 40.9% of owner-occupied homes, and their median energy score of 68 is one point higher. Social rented homes do best, at 73.5% rated C or better.
What the 2030 Standard Means
Since April 2020, privately rented homes have needed a rating of at least E unless they have an exemption. The government has confirmed that from 1 October 2030 they will need to reach the equivalent of C, with a cap of £10,000 on what a landlord must spend on each home. The rules still need Parliament’s approval, and compliance will be measured with new energy performance metrics.
On today’s certificates, 4,170 of Cheltenham’s 4,571 privately rented homes below C could reach C or better with the improvements their certificates list, such as insulation, double glazing or a more efficient boiler.
Data from the Energy Performance of Buildings Register, published under the Open Government Licence v3.0. Last updated 2026-10-11.
Notes to Editors
- Method: each home counts once, using its latest Energy Performance Certificate. Homes are placed in wards by their postcode. “Could reach C” uses each certificate’s potential rating, the rating the home would have if its recommended improvements were made.
- Sources: the Energy Performance of Buildings Register (Ministry of Housing, Communities and Local Government); Census 2021 table TS054, tenure, via Nomis; and the government’s response to its consultation improving the energy performance of privately rented homes.
- Caveats: tenure is recorded when a certificate is issued, so a home let using the certificate from its last sale counts as owner-occupied, and 8,875 certificates in Cheltenham don’t record tenure. The figures are therefore minimum counts. Ratings are under the current methodology; the 2030 standard will be measured with new metrics, which may place some homes differently.
- Data and updates: the home energy ratings page is updated monthly. For questions or interviews, use the contact page.
Cite This
Please credit Cheltenham Open Data and link to this page. Suggested citation:
Cheltenham Open Data (2026). At Least 4,500 Privately Rented Homes in Cheltenham Fall Short of the 2030 Energy Standard. Published 2026-10-15. https://cheltenham-od.uk/news/cheltenham-private-rented-energy-ratings. Data: Energy Performance of Buildings Register, Ministry of Housing, Communities and Local Government, published under the Open Government Licence v3.0.To embed the chart on your own site, copy this code:
<a href="https://cheltenham-od.uk/news/cheltenham-private-rented-energy-ratings"><img src="https://cheltenham-od.uk/assets/findings/cheltenham-private-rented-epc.svg" alt="Bar chart of privately rented homes rated below EPC C in each Cheltenham ward. Lansdown has the most at 735, then All Saints 575, Pittville 444, College 427 and Park 417. No other ward has more than 375, and most have between 90 and 135." width="640"></a>The chart and data are free to reuse with credit. The underlying data is published under the Open Government Licence v3.0.
Spotted an error? Tell us and we will correct it, with a note on this page saying what changed and when.
FAQs
Which Cheltenham Wards Have the Most Rented Homes Below C?
- Lansdown (735), All Saints (575), Pittville (444), College (427) and Park (417), all in the centre of town.
What Do Landlords Need to Do by 2030?
- Privately rented homes in England and Wales will need to reach the equivalent of EPC band C by 1 October 2030, or have a valid exemption, with spending capped at £10,000 a home.
How Can I Check a Rented Home’s Rating?
- Search by postcode on GOV.UK’s find an energy certificate service. Landlords must give tenants a copy of the certificate.
Can I Use This Chart?
- Yes. Credit Cheltenham Open Data and link to this page. The embed code and a CSV of the figures are in the Cite This section above.