Two Cheltenhams: Neighbourhoods Half a Mile Apart Sit at Opposite Ends of England's Deprivation Rankings
How Cheltenham's 77 neighbourhoods rank in the government's English Indices of Deprivation 2025, and how close together the town's extremes sit.
By Mat Benfield · Published 2026-10-13
Part of St Mark's is among the most deprived 5% of neighbourhoods in England, about half a mile from a Benhall neighbourhood in the least deprived 4%.
Source: MHCLG English Indices of Deprivation 2025.
Cheltenham Open Data compared all 77 of Cheltenham’s neighbourhoods in the government’s 2025 deprivation figures. Taken as a whole, Cheltenham is one of the less deprived places in England. It ranks 234th of 296 districts, where 1st is the most deprived. But the borough average hides very different neighbourhoods, sometimes within a few streets of each other. Every neighbourhood is mapped on the Cheltenham deprivation page.
Key Figures
- 1,561st of 33,755: the national rank of Cheltenham’s most deprived neighbourhood, in St Mark’s, where 1st is the most deprived.
- 32,614th: the rank of the Benhall neighbourhood about half a mile away.
- 33,705th: the rank of Cheltenham’s least deprived neighbourhood, in Leckhampton. Only 50 neighbourhoods in England are less deprived.
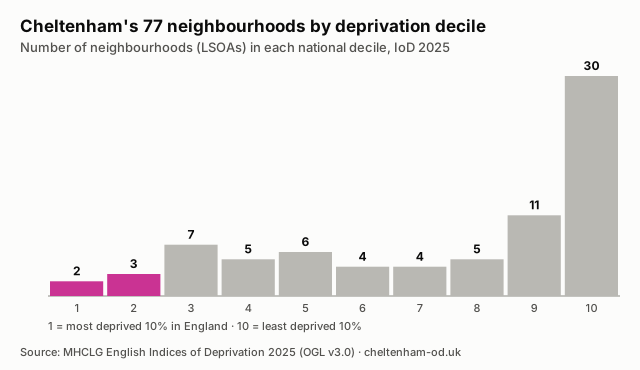
- 5 of 77 Cheltenham neighbourhoods are in England’s most deprived 20%, and 41 are in the least deprived 20%.
- £229,500 median house sale price over the past year in Hesters Way, against £517,250 in Leckhampton.
Half a Mile, Two Different Towns
The St Mark’s neighbourhood is in the most deprived 10% in England for income, employment, education, health and crime. It is home to about 1,750 people. A short walk south, across the ward boundary into Benhall, the Reddings and Fiddler’s Green, sits a neighbourhood ranked among the least deprived in the country.
St Paul’s has Cheltenham’s second most deprived neighbourhood, ranked 2,298th, and Hesters Way has the next two. At the other end, 30 of Cheltenham’s 77 neighbourhoods, almost two in five, are in England’s least deprived 10%.
The gap shows up in house prices too. The median sale price in Hesters Way over the latest 12 months was £229,500. In Leckhampton it was £517,250, more than twice as much. Ward-by-ward figures are on the Cheltenham wards page.
Notes to Editors
- Method: Neighbourhoods are lower layer super output areas (LSOAs), small areas of about 1,500 people used for official statistics. England has 33,755 of them, ranked from 1 (most deprived) to 33,755 (least deprived). Distances are measured between the centres of each area. District rank is the rank of the average score.
- Sources: Ministry of Housing, Communities and Local Government English Indices of Deprivation 2025, and HM Land Registry Price Paid Data for house prices.
- Caveats: Deprivation ranks are relative. They show which areas are more deprived than others, not by how much, and not every person in a deprived area is deprived. Ranks from 2025 cannot be compared directly with earlier editions because neighbourhood boundaries and some indicators changed.
- Data and updates: The indices are published every few years; the previous edition was in 2019. House prices on the wards page come from HM Land Registry Price Paid Data. For questions or interviews, use the contact page.
Data from the English Indices of Deprivation 2025 and HM Land Registry Price Paid Data, published under the Open Government Licence v3.0. Last updated 2026-10-05.
Cite This
Please credit Cheltenham Open Data and link to this page. Suggested citation:
Cheltenham Open Data (2026). Two Cheltenhams: Neighbourhoods Half a Mile Apart Sit at Opposite Ends of England's Deprivation Rankings. Published 2026-10-13. https://cheltenham-od.uk/news/cheltenham-deprivation-two-cheltenhams. Data: MHCLG English Indices of Deprivation 2025, published under the Open Government Licence v3.0.To embed the chart on your own site, copy this code:
<a href="https://cheltenham-od.uk/news/cheltenham-deprivation-two-cheltenhams"><img src="https://cheltenham-od.uk/assets/findings/cheltenham-deprivation-two-cheltenhams.svg" alt="Bar chart of Cheltenham's 77 neighbourhoods by national deprivation decile. Two are in the most deprived 10% and three in the next 10%. Thirty are in the least deprived 10%." width="640"></a>The chart and data are free to reuse with credit. The underlying data is published under the Open Government Licence v3.0.
Spotted an error? Tell us and we will correct it, with a note on this page saying what changed and when.
FAQs
What Is the Most Deprived Area of Cheltenham?
- Part of St Mark’s, ranked 1,561st of 33,755 neighbourhoods in England, where 1st is the most deprived. Parts of St Paul’s and Hesters Way are next.
What Is the Least Deprived Area of Cheltenham?
- Part of Leckhampton, ranked 33,705th of 33,755. Only 50 neighbourhoods in England are less deprived.
Is Cheltenham a Deprived Town?
- Not overall. It ranks 234th of 296 districts in England, where 1st is the most deprived. But five of its 77 neighbourhoods are in England’s most deprived 20%.
Can I Use This Chart?
- Yes. Credit Cheltenham Open Data and link to this page. The embed code and a CSV of the figures are in the Cite This section above.