People Walking and Cycling Are More Than Half of Those Killed or Seriously Injured on Cheltenham's Roads
Who is hurt on Cheltenham's roads, where and when, from five years of police-reported collisions in the Department for Transport's road safety data.
- RSS Feed subscribe via our feed/rss →
By Mat Benfield · Published 2026-10-20
Pedestrians and cyclists were 110 of the 196 people killed or seriously injured on Cheltenham's roads from 2021 to 2025, or 56%.
Source: Department for Transport road safety data (STATS19).
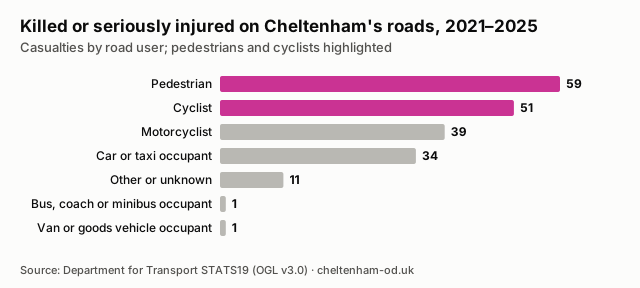
Cheltenham Open Data analysed five years of police-reported collisions in Cheltenham, from 2021 to 2025. Police recorded 674 injury collisions over that time, with 774 casualties. Seven people died: four pedestrians, two motorcyclists and one car occupant. Of the 196 people killed or seriously injured, car and taxi occupants were 34, or 17%. Every collision is mapped on the Cheltenham road collisions page.
Key Figures
- 56% of those killed or seriously injured were pedestrians (59) or cyclists (51).
- 26% of all casualties were cyclists: 199 of 774, more than any group except car occupants.
- 4 of 7 deaths were pedestrians.
- 79% of collisions (534) happened on 30mph roads and 3% (19) on 20mph roads.
- 106 collisions on the A40, the most of any road, including two fatal and 26 serious.
Who Gets Hurt Worst
Car and taxi occupants were the largest group of casualties, at 282, but only one in eight of them was killed or seriously injured. For pedestrians, it was close to two in five (59 of 150). For cyclists it was one in four (51 of 199), and for motorcyclists two in five (39 of 94). The people with least protection make up most of the serious harm.
When and Where
Collisions rose from 101 in 2021, when Covid restrictions kept traffic low, to 161 in 2024, before falling to 134 in 2025. A roads carried 38% of collisions. The A40 recorded 106, ahead of the A46 with 56 and the A4019 with 44. A quarter of collisions happened in the dark.
Most of Cheltenham’s roads are 30mph, so most collisions happen on them. The small number on 20mph roads reflects how few roads have that limit, and on its own does not show whether 20mph limits are safer.
Notes to Editors
- Method: Counts of police-reported injury collisions and casualties within Cheltenham borough for the five calendar years 2021 to 2025. “Killed or seriously injured” counts each casualty once, at their most severe injury.
- Source: Department for Transport road safety data (STATS19).
- Caveats: Only collisions reported to the police are included, and many slight injuries, especially to cyclists, are never reported. Gloucestershire Constabulary has classified severity from the injuries recorded since November 2015, so all five years are counted the same way. That system tends to record more injuries as serious than older methods, so compare serious casualty figures with forces or years using a different system with care. 2021 traffic was lower than usual because of Covid restrictions.
- Data and updates: The collisions page adds each year once the Department for Transport publishes final figures, now each July. For questions or interviews, use the contact page.
Data from the Department for Transport road safety data (STATS19), published under the Open Government Licence v3.0. Last updated 2026-10-05.
Cite This
Please credit Cheltenham Open Data and link to this page. Suggested citation:
Cheltenham Open Data (2026). People Walking and Cycling Are More Than Half of Those Killed or Seriously Injured on Cheltenham's Roads. Published 2026-10-20. https://cheltenham-od.uk/news/cheltenham-road-casualties-walking-cycling. Data: Department for Transport road safety data (STATS19), published under the Open Government Licence v3.0.To embed the chart on your own site, copy this code:
<a href="https://cheltenham-od.uk/news/cheltenham-road-casualties-walking-cycling"><img src="https://cheltenham-od.uk/assets/findings/cheltenham-road-casualties-walking-cycling.svg" alt="Bar chart of people killed or seriously injured on Cheltenham's roads from 2021 to 2025 by road user: pedestrians 59, cyclists 51, motorcyclists 39, car or taxi occupants 34, other or unknown 11, van occupants 1, bus occupants 1." width="640"></a>The chart and data are free to reuse with credit. The underlying data is published under the Open Government Licence v3.0.
Spotted an error? Tell us and we will correct it, with a note on this page saying what changed and when.
FAQs
How Many People Have Died on Cheltenham’s Roads?
- Seven people died in road collisions in Cheltenham between 2021 and 2025: four pedestrians, two motorcyclists and one car occupant.
Which Road in Cheltenham Has the Most Collisions?
- The A40, with 106 injury collisions from 2021 to 2025, followed by the A46 with 56 and the A4019 with 44.
Are Cyclists at Greater Risk in Cheltenham?
- Cyclists were 26% of all road casualties and 26% of those killed or seriously injured. One in four cyclist casualties was killed or seriously injured, compared with one in eight car occupants.
Can I Use This Chart?
- Yes. Credit Cheltenham Open Data and link to this page. The embed code and a CSV of the figures are in the Cite This section above.